GDP Growth Rate For India – How Has India’s Economy Grown Since Independence?
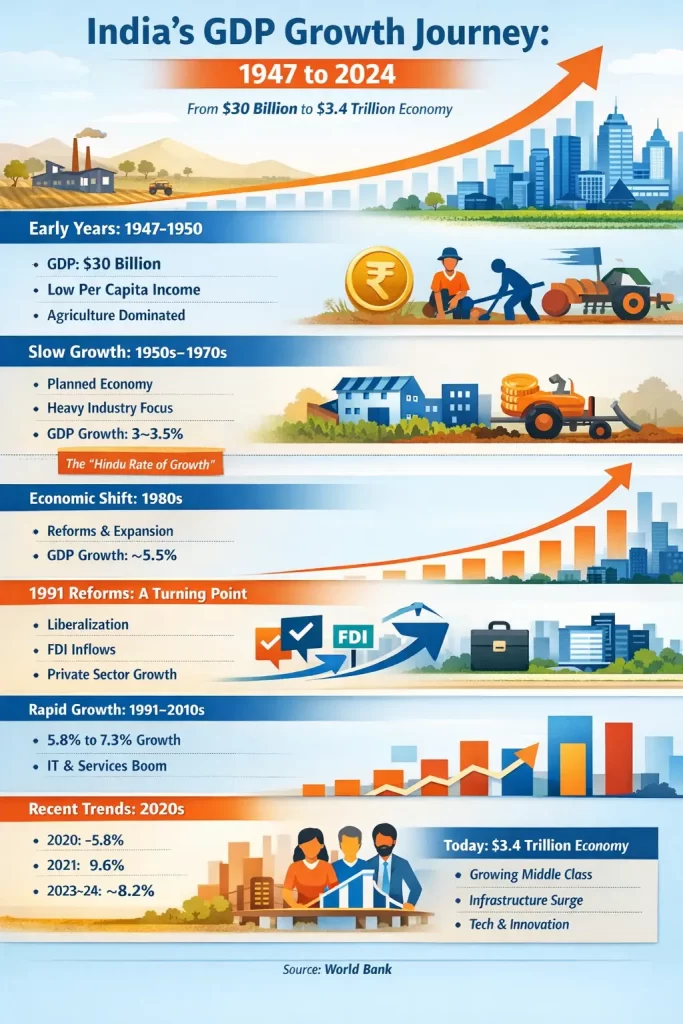
Tracking GDP growth rate for India since independence to understand the country’s economic growth story. Well, when India became independent in 1947, its economy was small.
Agriculture dominated jobs and income, while industry was limited. Over the next seven decades, India transformed into one of the world’s largest and fastest-growing major economies.
This article explains India’s economic journey using Gross Domestic Product or GDP growth rate for India data, key policy phases, and long-term trends in simple terms.
From a $30-billion economy in 1947 to a $3.4-trillion powerhouse in 2024, India’s growth story reflects slow beginnings, bold reforms, and steady resilience.
Source: World Bank (historical GDP estimates and recent national accounts data)
Table of Contents
India’s GDP Growth at a Glance
| Indicator | Value |
|---|---|
| GDP at Independence (1947) | ~$30 billion |
| GDP Size (2023–24) | ~$3.4–3.6 trillion |
| Fastest-Growing Decade | 2000s |
| Worst Growth Year | 2020 (COVID-19) |
| Current Growth Range | ~6.5–7.5% |
| Largest GDP Sector | Services (~60%) |
| Long-Term Trend | Strong & upward |
Sources: World Bank, Macrotrends, Government of India
What Was India’s Economic Condition at Independence (1947–1950)?
At independence, India inherited a weak and underdeveloped economy.
- GDP: ~$30 billion
- Very low per-capita income
- Agriculture produced nearly 50% of output
- Limited industrial base
- High poverty and illiteracy
The focus was on stability, food security, and institution-building, not rapid growth.
Why Was GDP Growth Rate for India Slow in the 1950s–1970s?
India adopted a planned, state-led development model.
Policies That Shaped This Period
- Five-Year Plans
- Public sector dominance
- Import substitution and licensing
- Restricted private investment
Growth Outcome
- Average GDP growth: ~3–3.5%
- This era became known as the “Hindu Rate of Growth”
Growth was stable but insufficient to rapidly raise living standards.
How Did India’s Economy Start Growing Faster in the 1980s?
The 1980s marked the first acceleration phase.
What Changed?
- Partial deregulation
- Higher government spending
- Expansion of manufacturing and services
Result
- Average GDP growth rose to ~5.5%
- Growth relied on borrowing, leading to fiscal stress
This imbalance triggered the 1991 crisis.
What Happened in 1991 and Why Was It a Turning Point?
India faced a balance-of-payments crisis in 1991.
Key Reforms Introduced
- End of Licence Raj
- Trade liberalisation
- Opening to foreign investment
- Expanded role of private sector
These reforms permanently changed India’s growth trajectory.
GDP Growth After 1991 Reforms: Faster & More Stable
| Period | Average GDP Growth |
|---|---|
| 1991–2000 | ~5.8% |
| 2001–2010 | ~7.3% |
Growth Drivers
- IT and software exports
- Telecom expansion
- Rising domestic consumption
India emerged as a global services powerhouse.
Challenges During High-Growth Years (2010–2019)
India entered the 2010s as a fast-growing economy.
| Year | GDP Growth |
|---|---|
| 2010–11 | 8.5% |
| 2016–17 | 8.3% |
| 2018–19 | 6.5% |
Key Challenges
- Banking sector stress
- Global slowdown
- Investment cycle weakening
Growth moderated but remained strong by global standards.
COVID-19 Shock and Recovery
| Year | GDP Growth |
|---|---|
| 2020 | –5.8% |
| 2021 | 9.7% |
| 2022 | 7.0% |
India’s rebound was among the strongest worldwide, supported by reforms and public investment.
How Fast Is India’s Economy Growing Now? (2023–2025)
- FY 2023–24: ~8.2%
- FY 2024–25: ~6.5–6.8%
- FY 2025–26 (expected): ~7.4%
Institutions such as the Reserve Bank of India, International Monetary Fund, and Asian Development Bank project India to remain among the fastest-growing major economies.
Historical India GDP Size (Nominal USD) Since the 1980s
| Year | GDP Size |
|---|---|
| 1980 | ~$189 billion |
| 1990 | ~$321 billion |
| 2000 | ~$468 billion |
| 2005 | ~$834 billion |
| 2010 | ~$1.67 trillion |
| 2015 | ~$2.10 trillion |
| 2020 | ~$2.68 trillion |
| 2021 | ~$3.17 trillion |
| 2022 | ~$3.35 trillion |
| 2023 | ~$3.56 trillion |
Sources: World Bank Open Data, Macrotrends, Statista
Decade-Wise GDP Growth Rate for India
| Decade | Average Growth |
|---|---|
| 1950s | ~3.6% |
| 1960s | ~4.0% |
| 1970s | ~3.1% |
| 1980s | ~5.5% |
| 1990s | ~5.7% |
| 2000s | ~7.1% |
| 2010s | ~6.8% |
| 2020s* | ~6.5–7.0% |
Structural Shift in India’s Economy
Sectoral Share of GDP
| Sector | 1950s | 2020s |
|---|---|---|
| Agriculture | ~50% | ~15% |
| Industry | ~20% | ~25% |
| Services | ~30% | ~60% |
India has transitioned from an agriculture-led to a services-dominated economy.
Has GDP Growth Improved Living Standards?
Yes. Economic growth enabled major improvements:
- Literacy: <20% → 75%+
- Life expectancy nearly doubled
- Sharp poverty reduction
Growth created resources for development, though challenges remain.
India GDP Growth Forecast (2025–2028)
| Period | Growth Forecast | Source |
|---|---|---|
| FY 2025–26 | ~7.4–7.5% | Govt / SBI |
| FY 2025–26 | ~6.6% | IMF |
| FY 2025–26 | ~7.2% | ADB |
| FY 2026–27 | ~6.2% | IMF / OECD |
| Medium term | ~6.5–7.0% | Moody’s, S&P |
FAQs: India’s GDP Growth Rate
What is the recent GDP growth rate for India?
ndia’s GDP growth rate in 2023–24 was estimated at around 8 percent, according to official government data. This placed India among the fastest-growing major economies globally. Growth was supported by strong domestic demand, government spending, and investment.
How does India’s GDP growth rate compare to other emerging markets?
India’s GDP growth rate is generally higher than most emerging markets. While many developing economies grow at 3–5 percent, India has consistently recorded growth above 6 percent in recent years, except during global shocks like the pandemic. This makes India one of the fastest-growing large economies.
Where can I find detailed GDP growth reports for India?
Detailed GDP growth reports for India are available from:
Official government statistical releases
Central bank economic reports
International institutions such as global development and financial organizations
These reports include quarterly and annual growth data, sector-wise performance, and long-term trends.
Can investment platforms offer insights based on India’s GDP growth rate?
Yes. Many investment platforms use GDP growth data to provide macroeconomic insights. They explain how economic growth may affect stock markets, interest rates, corporate earnings, and long-term investment trends. GDP growth is often used alongside inflation and employment data.
What economic indicators affect India’s GDP growth rate?
Several key indicators influence India’s GDP growth rate:
1. Consumer spending
2. Government expenditure
3. Private investment
4. Exports and imports
5. Inflation and interest rates
6. Agricultural output and industrial production
Changes in these indicators directly impact overall economic growth.
How do India’s major industries contribute to its GDP growth rate?
India’s GDP growth comes from multiple sectors:
Services contribute the largest share, including IT, finance, and trade
Industry adds growth through manufacturing, construction, and infrastructure
Agriculture contributes a smaller share but remains important for employment and rural income
Growth in services and industry has driven India’s overall GDP expansion in recent decades.
Sources: World Bank Open Data, Press Information Bureau and MacroTrends
Interesting Reads
- PM SHRI Scheme -Transforming Indian Schools for a New Era of Education
- Majhi Ladki Behan Yojana Maharashtra – Benefits, Eligibility & How to Apply
- MSME Support – Top Government Schemes Offering Financial Support To Small Businesses
- EV Subsidy in India – Which Government Schemes Offer Subsidies for Electric Vehicle Buyers in India?